Home Assistant on RPi

I came across Home Assistant during some YouTube surfing. Seems some what interesting at the time. Then I took the plunge to see what this was all about.
In The Beginning
Okay, I came across the Home Assistant project on a couple of YouTube videos and decided to just dive in head first. “Lets see how far I get when going at full speed”. I grabbed my nearest Raspberry Pi 4 B+ card, formatted the SD card and about 10 minutes later I was up and nerding like a shell at the beach.
What I installed
Fast forward to about 2 weeks later and this is what I have installed and configured with useful results (below I list what I use each tool and how I configured it):
- ESPHome
- Grafana
- Home Panel
- InfluxDB
- Mosquitto Broker
- Terminal & SSH
Hope to use in the near future:
- Node-Red
- Z-Wave JS
Home Assistant
Installing this program is super easy and comes with two methods that are listed on the home assistant webpage of installation methods..
I went with the Home Assistant operating system because it was straight forward as compared to the docker container which does require knowledge about Docker.
After I got the installation done, I explored the following things:
Integrations
This thing was full of stuff it found on my network that took little to no time in setup. Just some reading of text and some clicks and I got my printer ink levels automatically.
Other things like Google Nest were super involved and it was really helpful to have knowledge of Cloud infrastructure to navigate around with confidence.
Dashboards
It comes with a default dashboard that has everything populated. If you make your own, I think it says it will remove it and then you have ability to customize it all you want. Dont worry about this as adding cards is very simple and you will figure it out really fast.
ESPHome
This thing is so awsome. I have about 5 units of the Feather Huzzah esp8266 which are super small and come in at a very good price.
ESPHome makes managing these so much easier! Their website is stocked with great cookbook documentation as well as other knowledge of how
to make updating and running an esp chip. Here is a list of my favorite features of this project:
- OTA updating
- over the air updating, yah its just cool
- update code on Home Assistant, and then push to the board remotely
- enables simple management of the boards
- remote logging also comes with this
- YAML based configuration
- ESPHome allows for configuring the board in YAML
- Almost all types of configs are on their site
- Many types of functions available
- Deep sleep
- This allows for low battery consumption
- Eg. make the board sleep for 10min, wake up and process in 1sec
- Send message to MQTT broker to disable Deep Sleep to do OTA updating
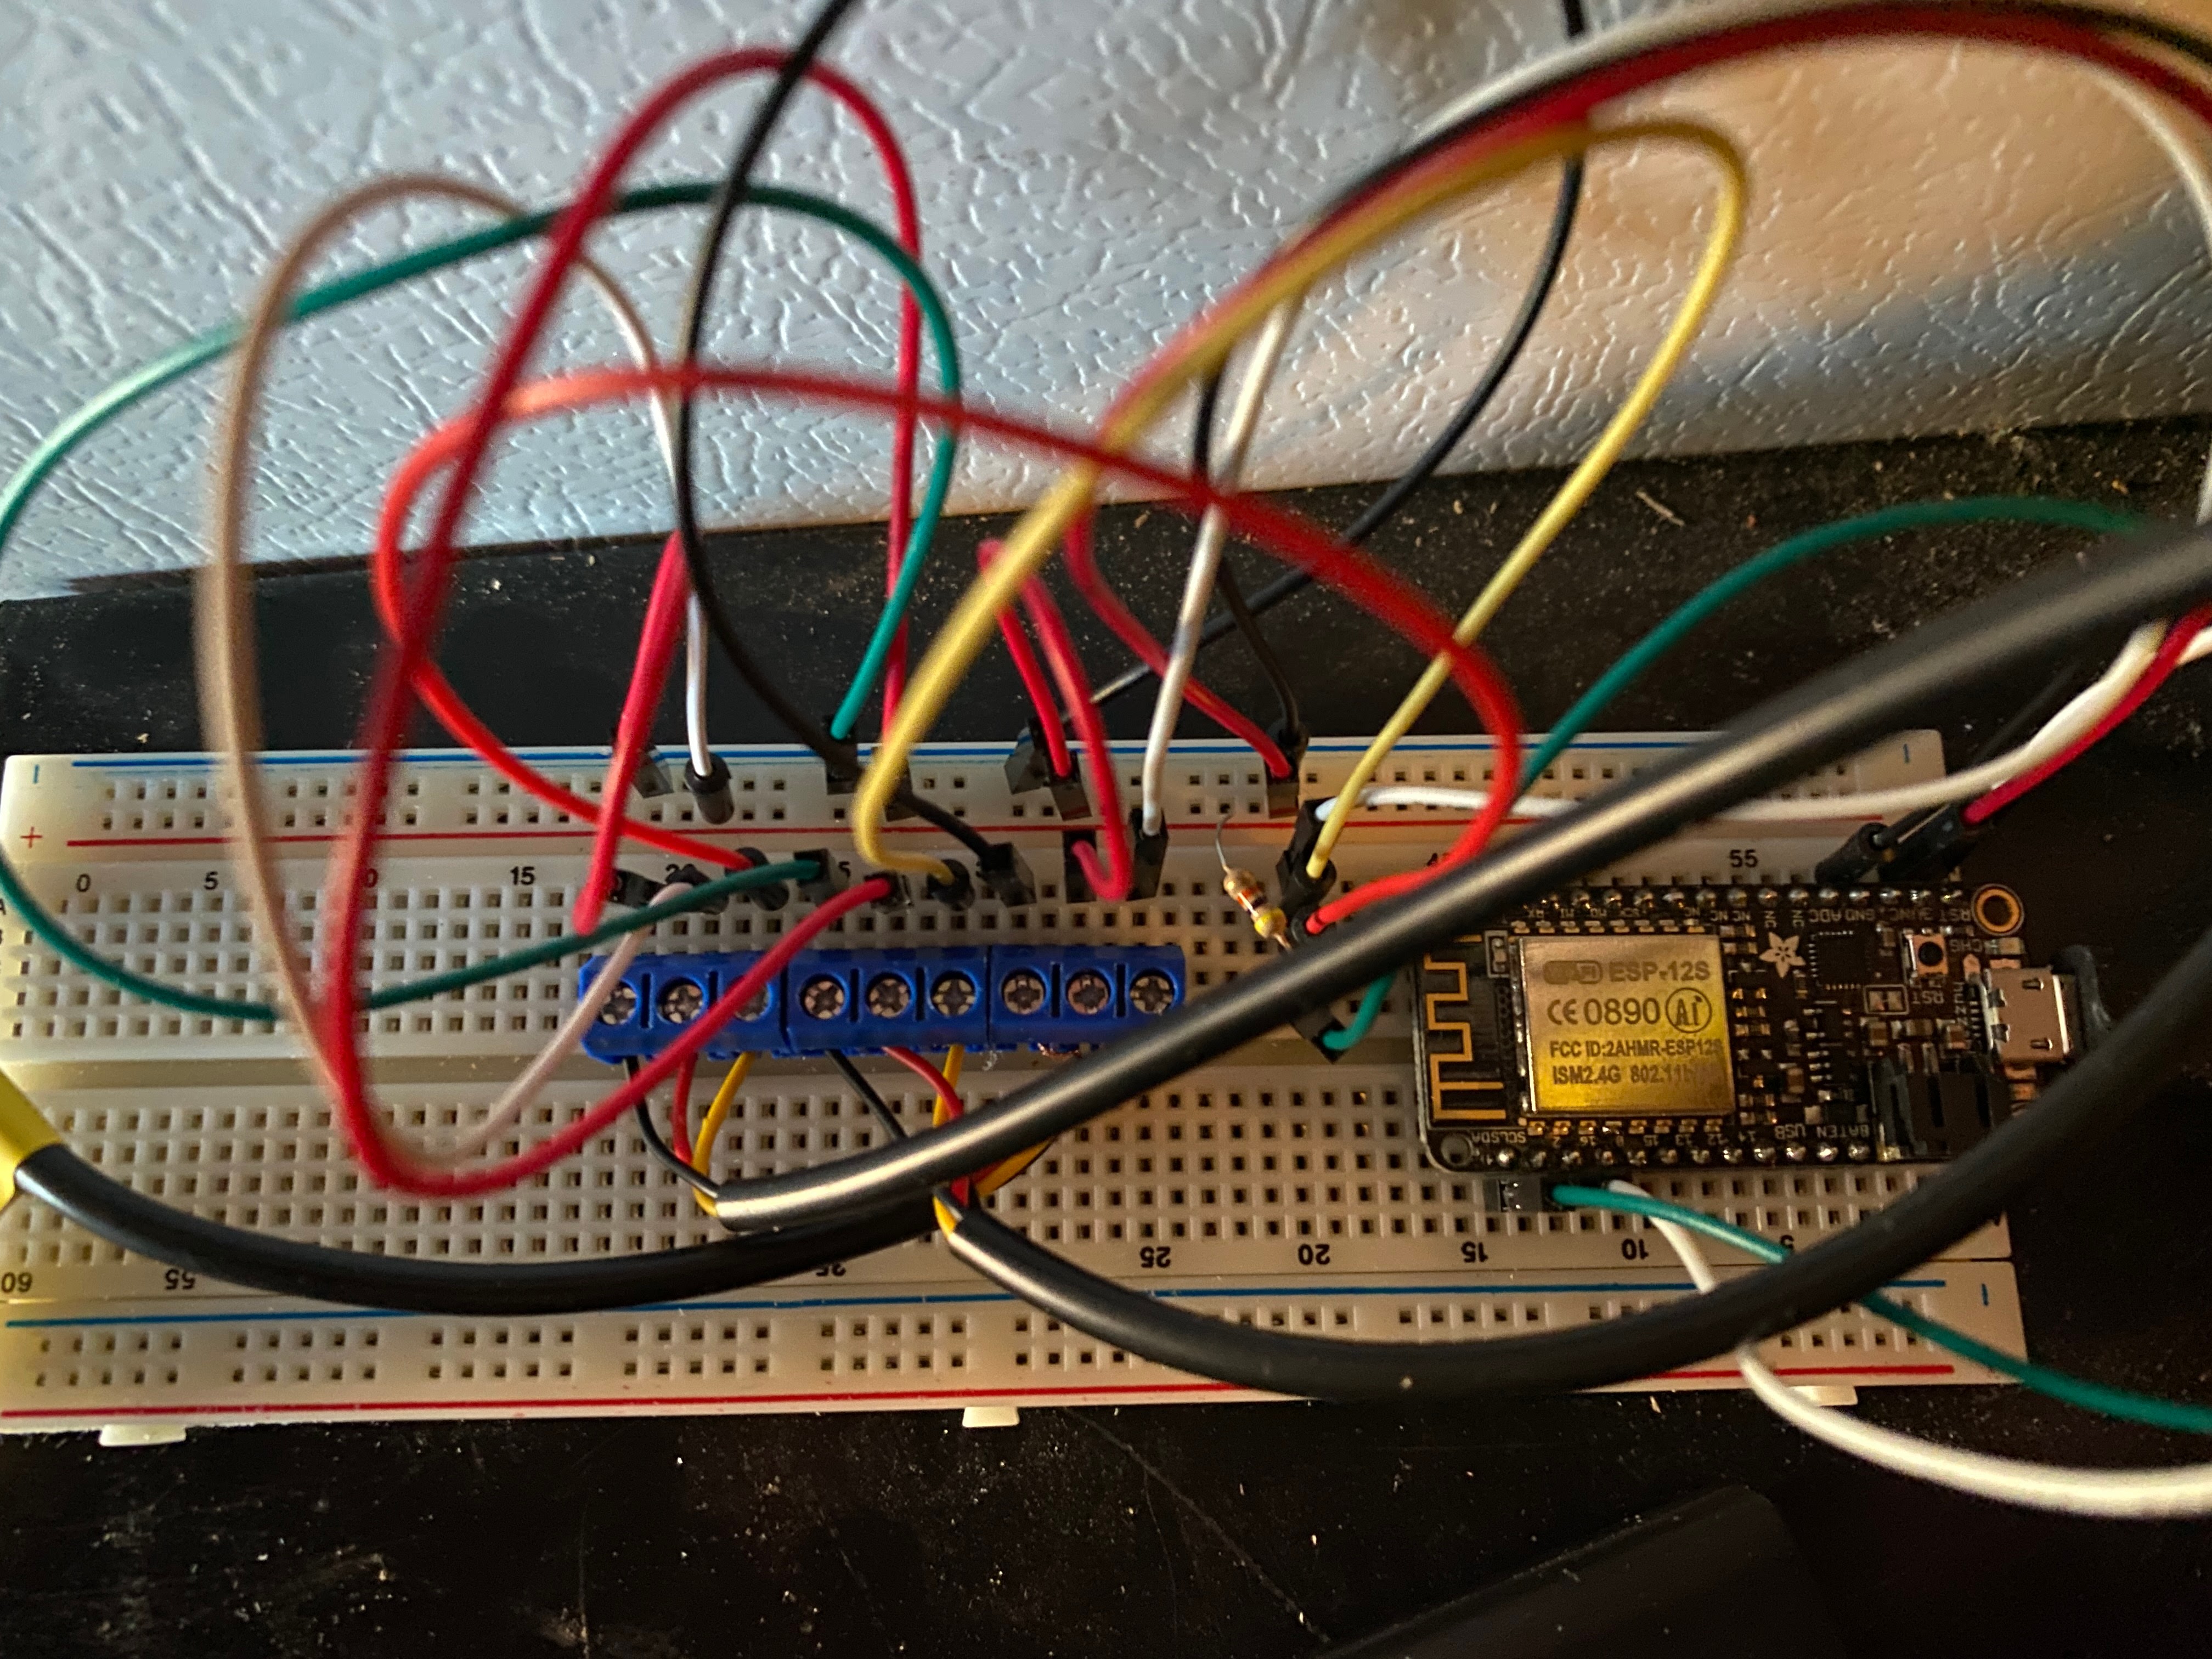
With all this in mind, here is what I did with my first sensor: Made a tempurature logging device for my garage refridgerator. This involved:
- 1 x 4.7k resistor
- 3 x 1-Wire tempurature sensors
- 1 x breadboard (for testing)
- Power supply (I went with a usb power bank, but waiting for a reliable plugin wall adaptor)
I tried to take a picture and it came out somewhat ok…
More details are on Esp8266 Tempurature With Home Assistant
But this breadboard diagram should be more helpful…
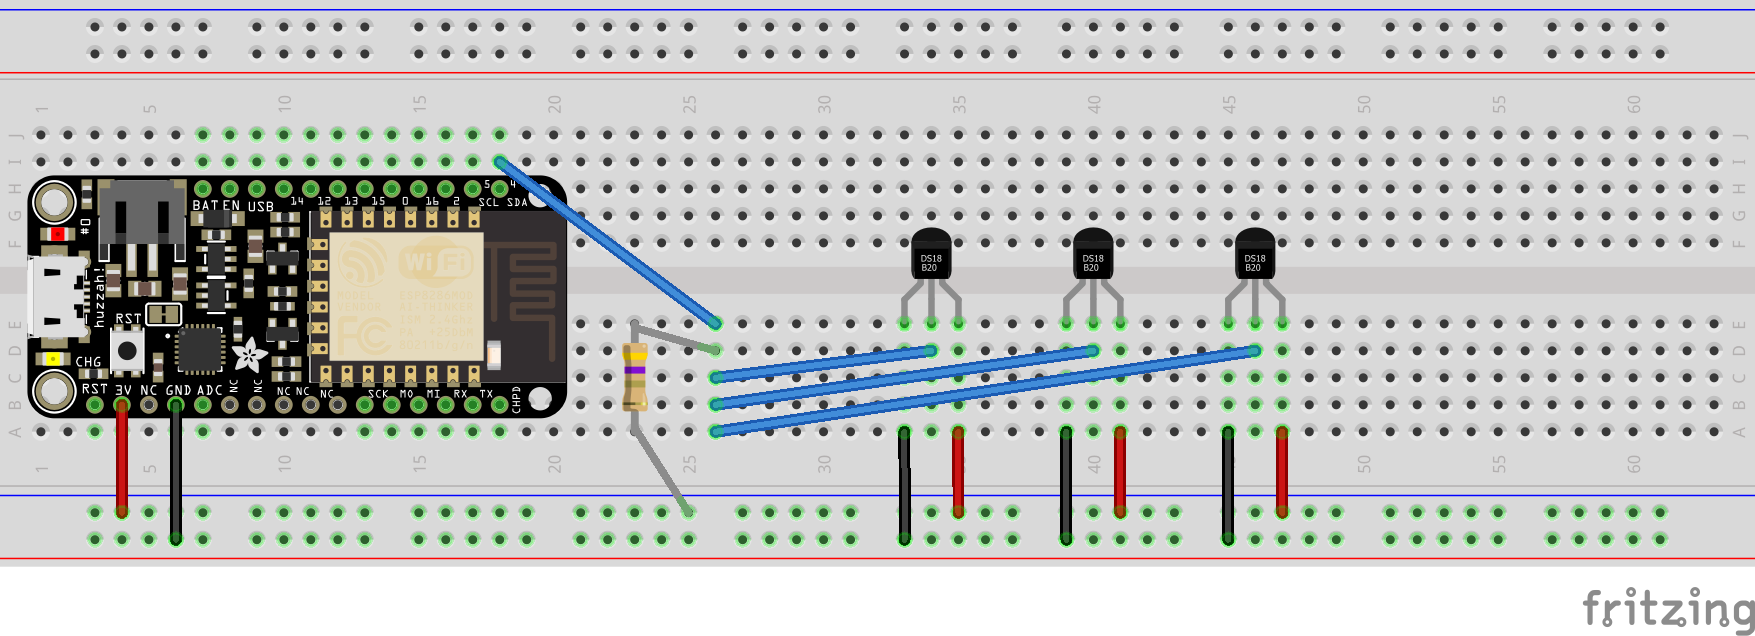
- red is +
- black is -
- blue is data
While it might not match up with the photo I took of my setup the wiring is what I used.
Once this was all wired up, it was a simple matter of placing the sensors and then adding some graphs. This was all too easy.
Grafana and InfluxDB
This was really simple to setup as both products were installed with Supervisor and then it was a matter of:
- InfluxDB
- creating a database (I used
homeassistant) - creating a user
homeassistantwith a chosen password - granting access of the database
homeassistantto the userhomeassistant(never saw that one coming..did ya)
- creating a database (I used
- Grafana
- Configuration
- Add Data Source
- Name it “Home Assistant”
- Set the user name and password used above
- done.
Now everything that is being monitored by Home Assistant is now being recorded by InfluxDB and you can visualize with Grafana. This makes so many things possible. As an added bonus, I found this piece of json code on Grafana Labs to add every signal or metric being recorded by Home Assistant for vewing:
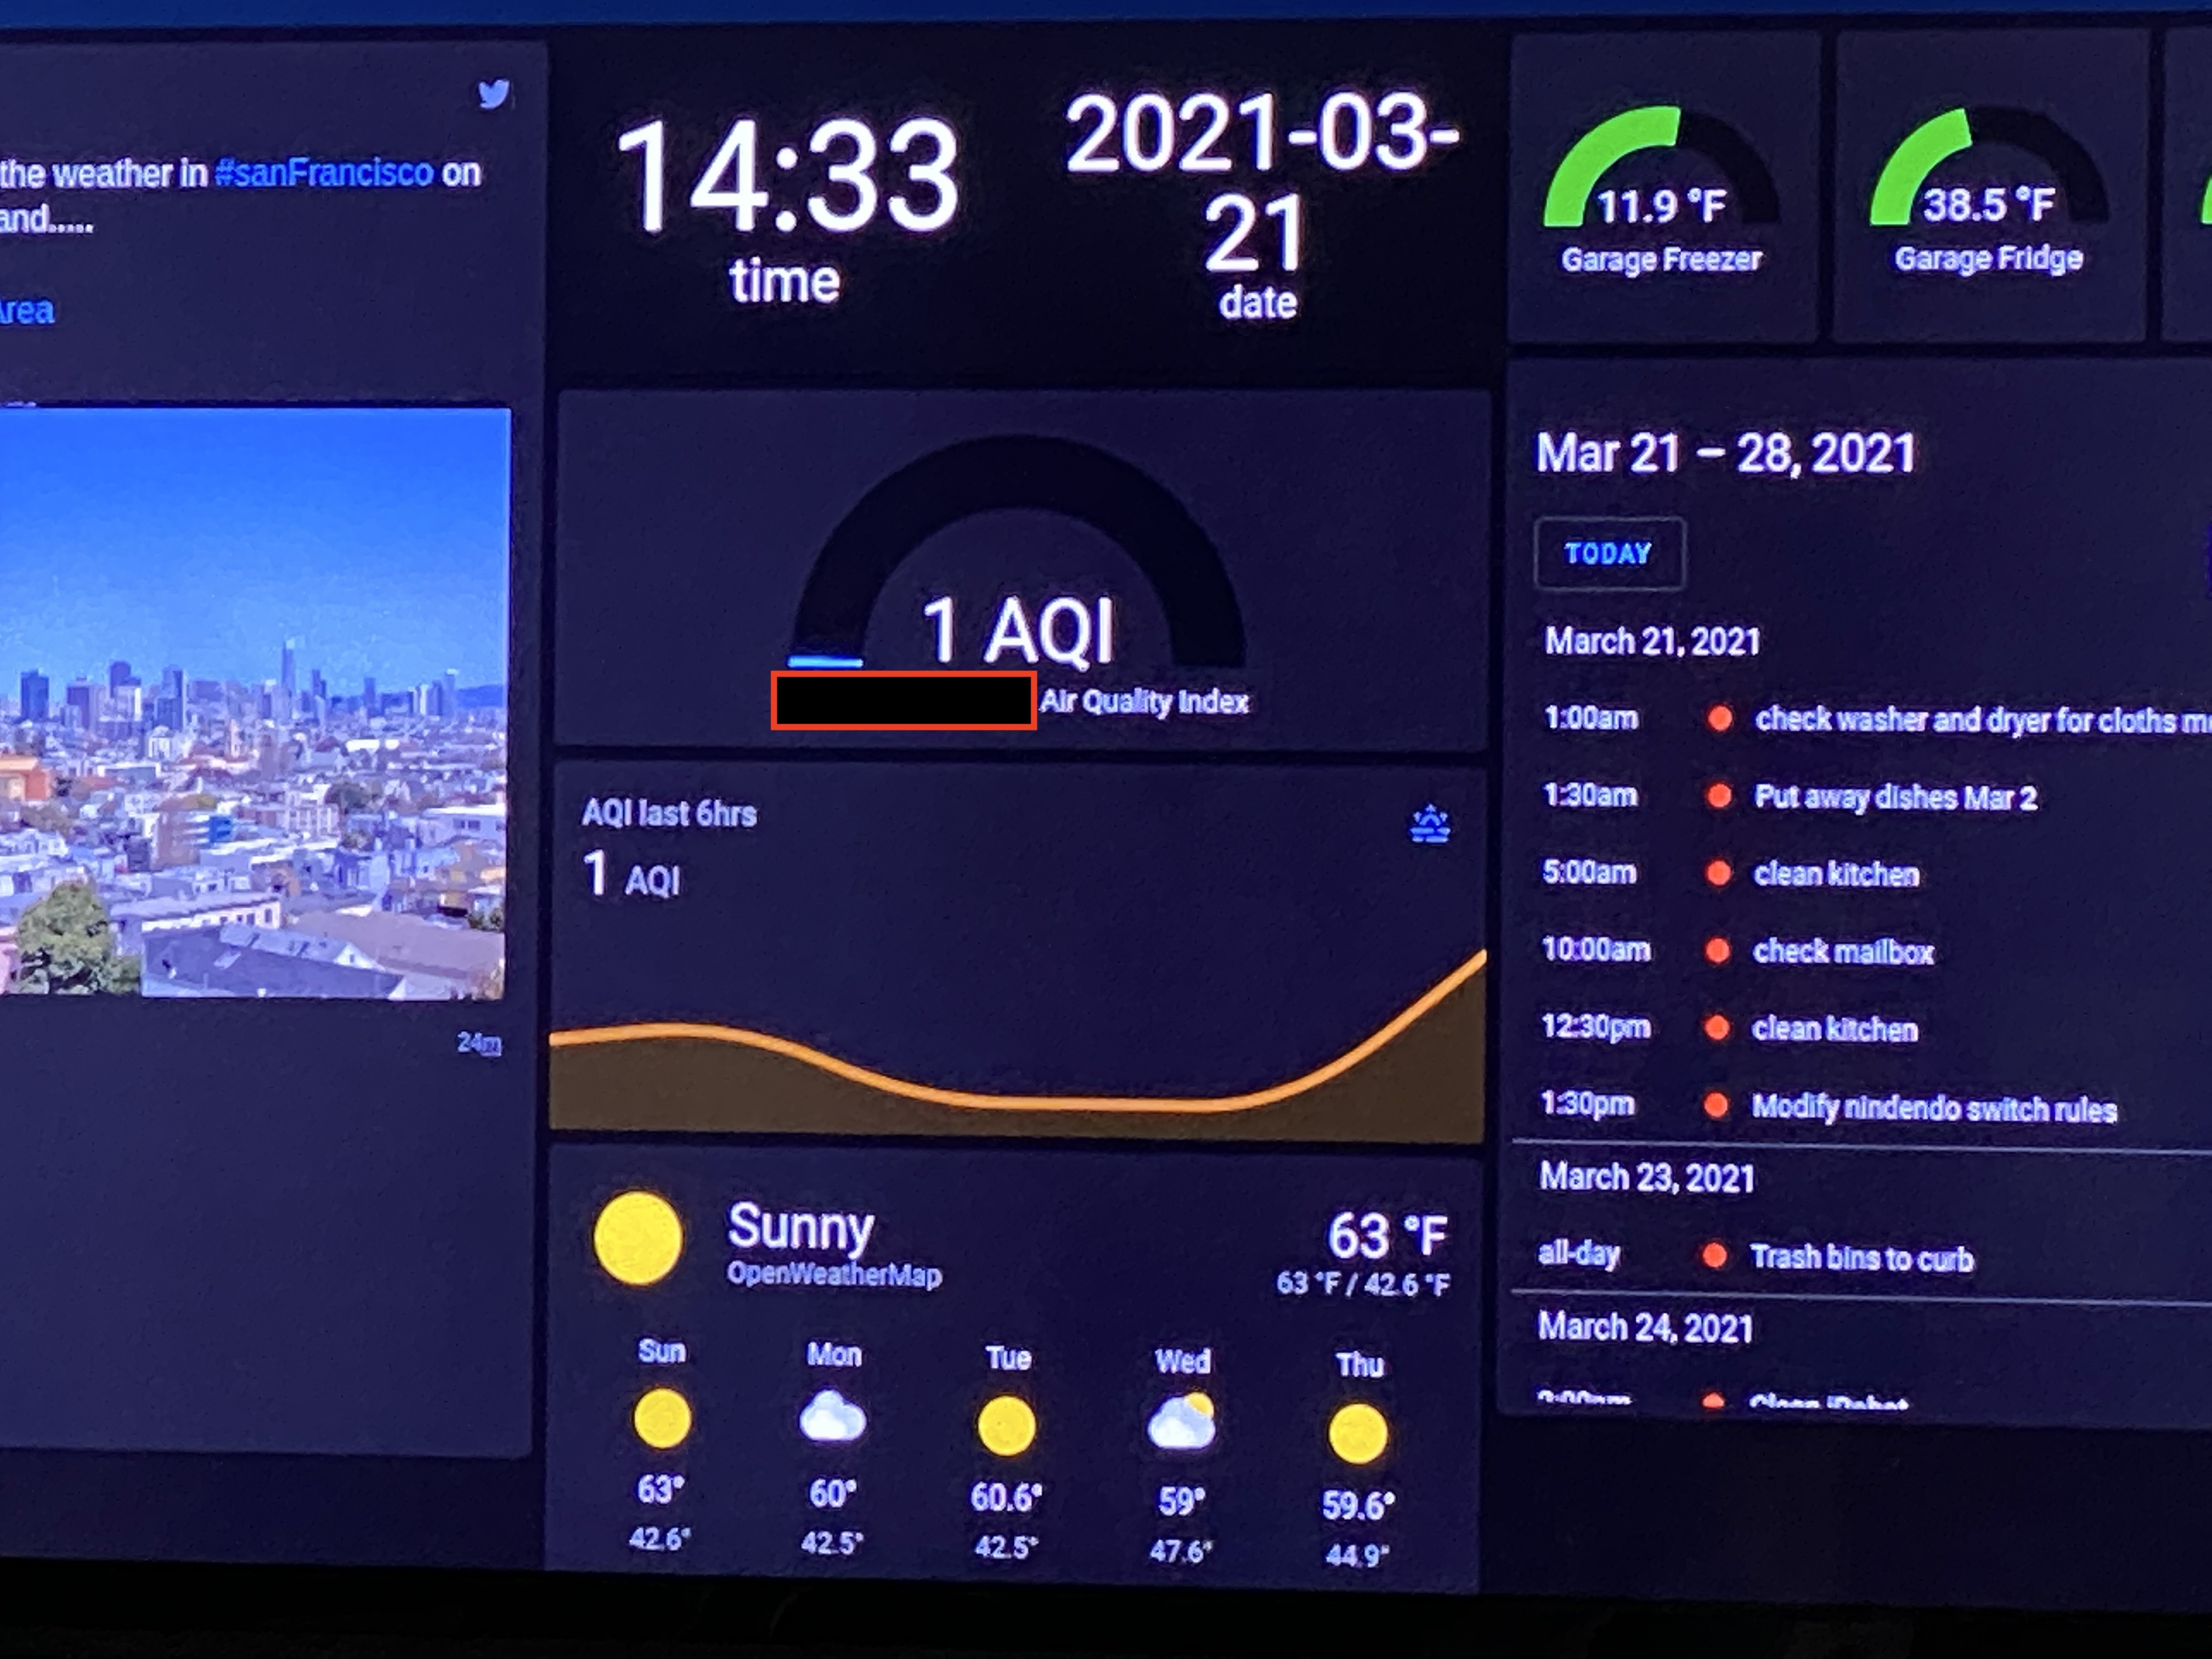
Home Panel
This one has been a hit and miss for me. While I understand that this is really meant for a small dashboard control panel on your wall or touch device, I tried it for my TV display and it was not the best. This had +/- reasons and they are:
- Plus
- Easy to read clock and date
- Nice layout tools
- Graphs are dual purpose charts and current value
- Minus
- Have to login twice
- No coloring of graphs (maybe there is something advanced I can do)
Mosquitto Broker
I have yet to dive into this component, but for now I am seeing its advantage by being behind the scene of the ESPHome where I set its configuration for allowing the ESPHome configs to send MQTT messages. I think this is great and I can really see its power when I start using other services that are hooked up to my Home Assistant.
Raspberry Pi things
As time has progressed, I have found the following get my Home Assistant closer to my goals to replace my DakBoard TV display which most people in my house use for checking time of day, weather, air quality, tasks, and calendar schedule. For the most part of checked off almost every one of these items except for the calendar item. I think my family was not using that one all that much. But if we change our minds I have an idea for showing the calendar on another page of the dashboard during certain hours of the day or by manually running a script over ssh with iOS Shortcuts. Yep, you read that right, I use iOS Shortcuts to execute ssh commands that send keyboard or mouse actions to the graphical display. Maybe its time to get a touch screen instead…Anyways, below are some of my Raspberry Pi items that have helped me along this journey:
TV raspberry pi to boot up to Home Assistant
pi@raspberrypi:~ $ cat .config/lxsession/LXDE-pi/autostart
@xset s off
@xset -dpms
@xset s 0 0
@xset s noblank
@xset s noexpose
@xset dpms 0 0 0
@chromium-browser --noerrdialogs --autoplay-policy=no-user-gesture-required --check-for-update-interval=1 --simulate-critical-update --kiosk http://homeassistant.local:8123/lovelace/main
Use the scripts below to login, move the mouse pointer, and click on elements.
Sending keyboard commands:
I made this shell script to do auto login of the webpage with a guest account and to auto reload the webpage with some keyboards.
Do do this, I logged into my Raspberry Pi, created the following scripts and add them to a crontab file to be run on a schedule.
Autologin script
pi@raspberrypi:~ $ cat autologin.sh
export XAUTHORITY=/home/pi/.Xauthority; export DISPLAY=:0; xdotool type guest
sleep 5
export XAUTHORITY=/home/pi/.Xauthority; export DISPLAY=:0; xdotool key ISO_Left_Tab
sleep 5
export XAUTHORITY=/home/pi/.Xauthority; export DISPLAY=:0; xdotool key ISO_Left_Tab
sleep 5
export XAUTHORITY=/home/pi/.Xauthority; export DISPLAY=:0; xdotool type guest
sleep 5
export XAUTHORITY=/home/pi/.Xauthority; export DISPLAY=:0; xdotool key Return
Autostay logged in
This will place a check box for the option “keep me logged in”
pi@raspberrypi:~ $ cat autostaylogin.sh
export XAUTHORITY=/home/USERNAME/.Xauthority; export DISPLAY=:0; xdotool mousemove 1260 713
sleep 5
export XAUTHORITY=/home/USERNAME/.Xauthority; export DISPLAY=:0; xdotool click 1
Set zoom level
pi@raspberrypi:~ $ cat autozoomout.sh
export XAUTHORITY=/home/USERNAME/.Xauthority; export DISPLAY=:0; xdotool keydown Control_L Shift_L
sleep 5
export XAUTHORITY=/home/USERNAME/.Xauthority; export DISPLAY=:0; xdotool key minus
sleep 5
export XAUTHORITY=/home/USERNAME/.Xauthority; export DISPLAY=:0; xdotool keyup Control_L Shift_L
crontab refresh
Turn on logging for cron
cat /etc/rsyslog.conf
cron.*      /var/log/cron.log
Create the file to refresh the page:
# file: /home/pi/autorefresh.sh
export XAUTHORITY=/home/pi/.Xauthority; export DISPLAY=:0; xdotool key F5
Create a file to run a script as the user named “pi”
# file: /etc/cron.d/autorefresh
# refresh every hour
0 * * * * pi /home/pi/autorefresh.sh
Home Assistant Dashboard items
Adding a twitter iframe
You can create files in the <config>/www/filename.html and it will be served up as web content by Home Assistant
<script>window.twttr = (function(d, s, id) {
  var js, fjs = d.getElementsByTagName(s)[0],
    t = window.twttr || {};
  if (d.getElementById(id)) return t;
  js = d.createElement(s);
  js.id = id;
  js.src = "https://platform.twitter.com/widgets.js";
  fjs.parentNode.insertBefore(js, fjs);

  t._e = [];
  t.ready = function(f) {
    t._e.push(f);
  };

  return t;
}(document, "script", "twitter-wjs"));</script>

<a data-tweet-limit="1" data-theme="dark" data-chrome="transparent nofooter noborders noheader noscrollbar" id="twitter-wjs" class="twitter-timeline" href="https://twitter.com/NWSBayArea?ref_src=twsrc%5Etfw">Tweets by NWSBayArea</a> <script async src="https://platform.twitter.com/widgets.js" charset="utf-8"></script>
and the resulting url for an iframe would be
http://homeassistant.local:8123/local/filename.html
Create a iframe/website card with its url from above and boom! Twitter feed. Downside is the content does not refresh
so I have taken to using the script of the autorefresh.sh to run every hour with crontab.
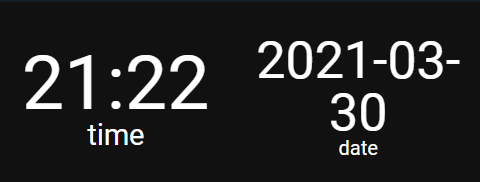
Changing card text size
So far the best modification to the dashboard for chaning text size has been Big Number Card which allows you to make some customized cards. I wanted a card with large clock and date format displayed and after long searching, bignumber-card checked the boxes that I was looking for at the time. Here is my config for displaying a large clock with the current date:
type: 'custom:bignumber-card'
title: time
entity: sensor.time
scale: 58px
from: bottom
min: 0
max: 100
color: '#FFF'
style: var(--label-badge-blue)
severity:
  - value: 70
    style: var(--label-badge-green)
  - value: 90
    style: var(--label-badge-yellow)
  - value: 100
    style: var(--label-badge-red)
    color: '#FFFFFF'
This card is best viewed on a dark-themed dashboard as I have white for the text.